
Summary: Due to the increased and increasing use of solar and wind power, which typically has to be consumed by the end user as soon as it is generated, California's grid already creates too much power during some times of the day. This is particularly true in the winter, spring, and fall months, when demand for power to cool homes is lower. During these times, California's solar and wind power generating resources are deliberately turned off to prevent overloading the grid. Yet inexplicably, KR3 remains online generating unnecessary and unneeded power. This post explains why KR3 should be taken offline during the hours of 9am and 3pm from February to June. During these periods of vast excess power generation from other sources, the highest and best use of the Wild and Scenic North Fork Kern is not power generation — there is too much of that already — but natural flows for recreational use and environmental protection.
Updated with 2023 CAISO data, May 29, 2024.

The deployment of renewables in California has been incredibly successful to this point on our state’s path to a green grid. However, it has brought along an unanticipated consequence: the threat of over-generation — that is, generating more power than the grid can handle. All power must serve a load, and system operator CAISO works tirelessly to equalize supply with demand. Balance has become more difficult with the deployment of renewables like wind and solar, which increasingly threaten to swamp the grid with too much energy production during daylight hours, leaving supply well above the levels of demand. That’s the risk of over-generation.
CAISO’s main strategy to prevent over-generation and balance supply with demand is called “curtailment,” which does what it says: curtail (lessen) the amount of generation by modern solar and wind generators whenever the grid is threatened. We’ll let CAISO speak for itself on the matter:
“Curtailment is the reduction of output of a renewable resource below what it could have otherwise produced. . . . Curtailing renewables results in lost opportunities for clean resources to generate all of the carbon-free power that otherwise could be produced. . . . Curtailing renewables is counterintuitive to California’s environmental and economic goals. It reduces the output from the renewable plants in which the state has invested, and could result in overbuilding renewable plants to ensure that the state meets its 50-percent renewable mandate
So curtailment as a strategy, while effective in keeping the grid safe, is not a desirable public policy. One of CAISO’s strategies to reduce the need for curtailment is to “reduce minimum operating levels for existing generators, thus making room for more renewable production.” In other words, reduce production to make room for wind and solar, keeping those more modern and rational generators online and profitable, so more will be built. That’s where the KR3 hydroproject should come in.
KR3 is a contributing cause to curtailment. Whenever over-generation is threatened, KR3’s production of electricity only adds to that threat, and causes modern generators like wind and solar to be sidelined to ensure that supply and demand balance out. The times when over-generation are threatened are ripe for reducing the output of KR3, “thus making room for more renewable production,” in the words of CAISO.
When are these times? According to the data, significant curtailment massively prevails between 9am and 3pm. This chart depicts the average daily curtailment for each hour in 2023:

Note we have included for reference the average rate of generation at KR3: 13.5 kW. KR3 almost never achieves its top rate of 36.8 kW because the “fuel” needed to obtain that rate — 600 cfs of diverted river water — is unavailable far more often than not. Indeed, as the following chart shows, KR3 routinely generates at a fraction of its top rate. KR3 generates at its highest rates in spring, energy demands are low and renewable curtailments are high. In all but the wettest of years, KR3 is generating at extremely low levels during late summer and early fall, when demand is high and the potential for “loss of load” (blackouts) is acute:

Back to the issue of renewable curtailment, it is important to note the phenomenon’s seasonal component in addition to its hourly nature. In winter and especially in spring, demand is relatively low, forcing widespread curtailment of wind and solar assets. The following graph depicts average daily curtailments quarterly in 2023. Note how the figures in Q1 & Q2 dwarf the KR3 reference line during sunlight hours. Indeed, each horizontal axis line represents a ten-fold increase above the average power that KR3 has generated over its current license term:

Combining those two aspects of curtailment — hour of the day and time of year — is revelatory. The following chart depicts CAISO curtailments in 2023 between the hours of 9am and 3pm for the months with the greatest amounts of renewable curtailment — February through June — and adds a reference line of KR3’s average generation for those months:

Again, each horizontal axis line in the above chart represents ten times the average generation at KR3 during those months. The chart supports the proposition that the energy generated by KR3 is simply not needed during the hours of 9am and 3pm February through June. Renewable curtailments during those hours in those months occur at a scales dwarfing the power KR3 generates. If KR3 were to go offline during those hours, its energy would be replaced by a vast pool of renewable generators that would otherwise sit idle.
Let’s focus in on those months, and compare average curtailments in 2023, by hour, against the average rates of generation for KR3. Starting with February 2023, curtailments between 9am and 3pm are more than 20 times greater than KR3’s average (15.1 MW) for that month. Again, the horizontal scale lines represent ten-fold multiples of KR3’s monthly average rate of production for February, showing that between 40 and 90 times the production of KR3 is curtailed.

Even as KR3 increases its average generation rate to 15.8 MW in March, curtailments went higher still, sidelining wind and solar in amounts more than seventy to one hundred ninety times larger than KR3’s average rate of output that month:

Moving to April, we see average hourly curtailments at a scale of more than seventy to one hundred twenty times the average rate of KR3 generation:

For May, we see average hourly curtailments at a scale of more than forty to sixty times the average rate of KR3 generation:

For June, we see average hourly curtailments at a scale of more than thirty to forty times the average rate of KR3 generation:

The following chart summarizes the preceding charts from February to June, showing the scope of renewable curtailments between 9am and 3pm as minimum, average, and maximum multiples of average KR3 generation:
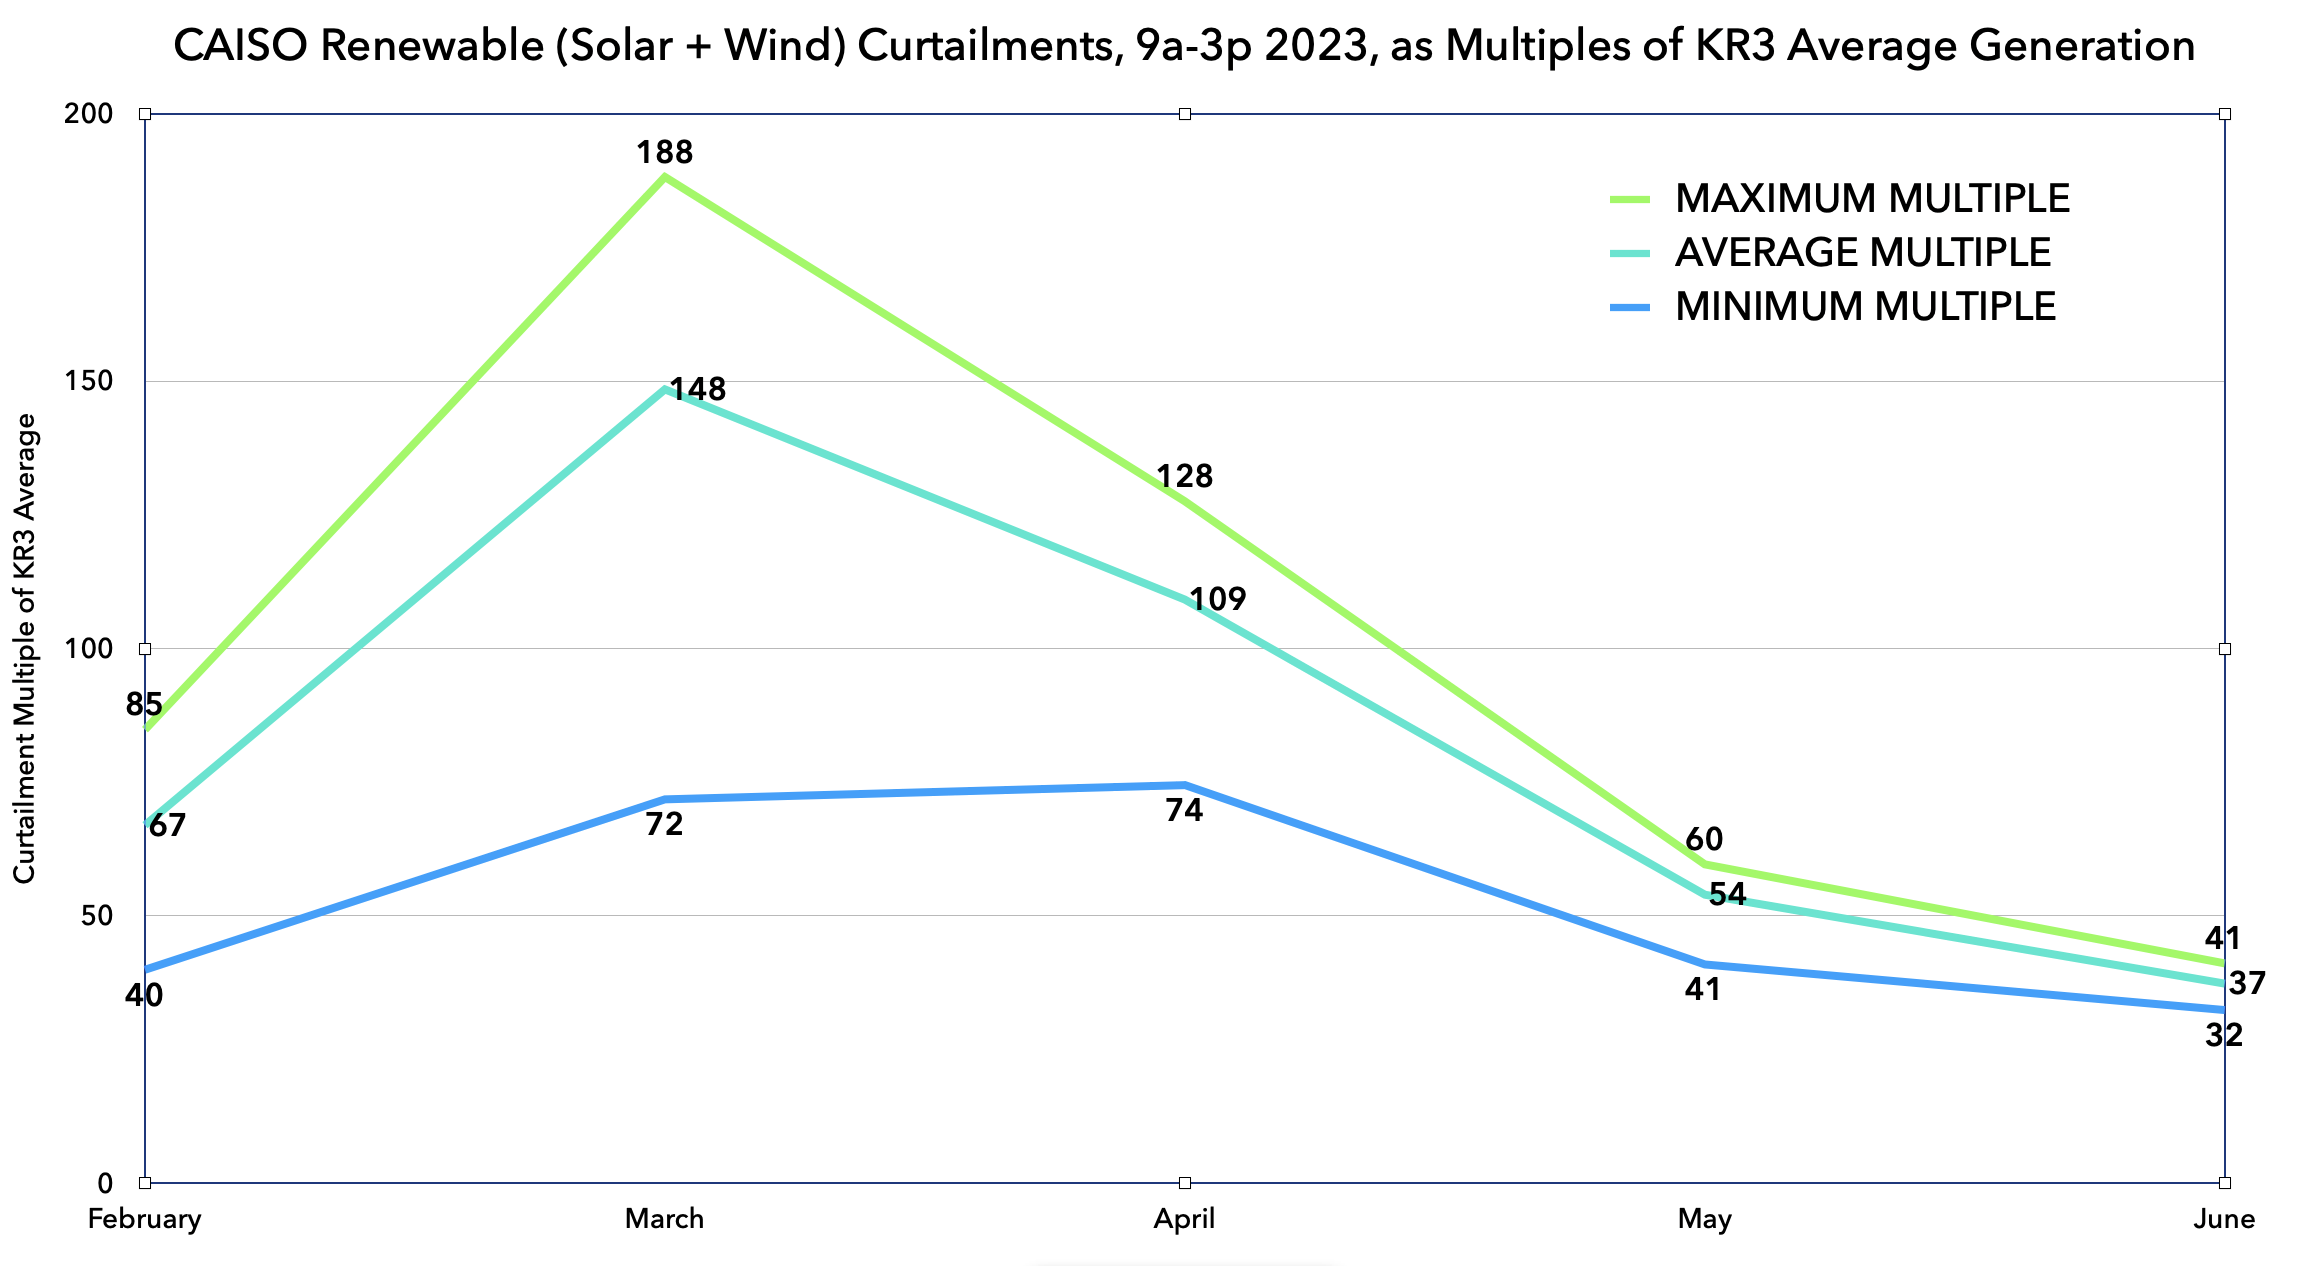
We believe these figures show that the energy KR3 produces during the hours of 9am and 3pm is not useful to society from February to June. It makes no sense to dewater the Wild and Scenic North Fork Kern during those hours when renewable generators with at least 32 times the generating power of KR3 — and usually much, much more — are sitting by idle on the sidelines. And don’t forget: according to CAISO the scale of renewable curtailments is expected to increase over the years of the next KR3 license as more and more wind and solar come online. KR3, by contrast, cannot increase its output over its historical averages, as the project is capped at diverting 600 cfs and is limited by unimpaired river flows, which, although they will continue to vary year-to-year, cannot be expected to appreciably change in median volume over the next license term. Given these facts, the water currently diverted for KR3 at these times should, going forward, be left in the river to maximize the social good.